Project 4: Country Populations
Country Population and Growth Rate Analysis
Problem Statement
It is no surpise that there are many developed nations around the world whose populations are declining. There are many factors that contribute to these trends such as low birth rates, emigration, cultural trends that avoid having families, etc. This Project will dive into the causes for these population declines by using clustering methods to determine which countries are experiencing a population growth, decline, or plateau.
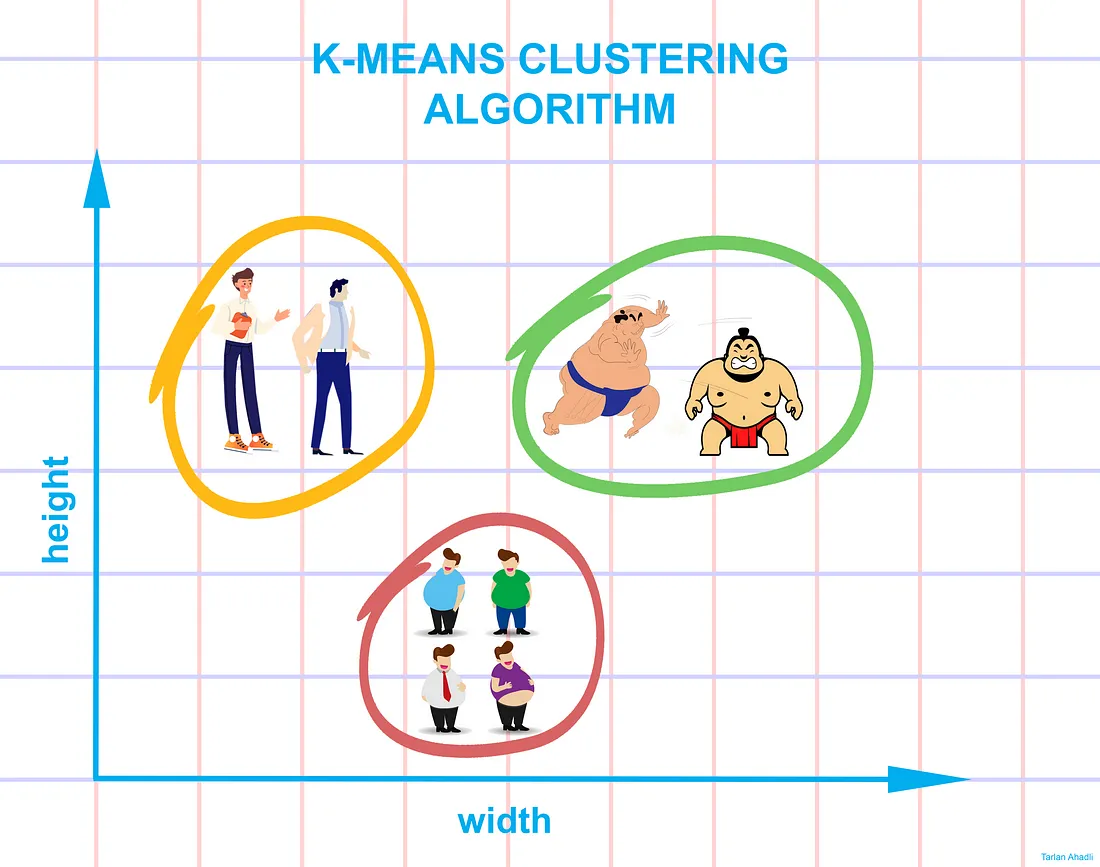
What is Clustering?
Clutering is a model learning method where data points are group based from close proximity of a certain parameter. For example, a country whose population growth rate in 2018 was -1.25% will likely be grouped in the same cluster as one whose population growth is -1.8%. We will use the K-means clustering method to achieve these results. K-means clustering takes a user inputted value called K and creates K amount of centroids each of which will group the same amount of data points. However, there are some flaws in this method. Using too little centroids will cause underfitting of the data (The model is too simple to draw conclusions). Using too many centroids will cause overfitting of the data (The model is too closely fit to the training data, making it inaccurate to predict new data). This means that we need to find the right amount of clusters to create that represents the data well.
Dataset
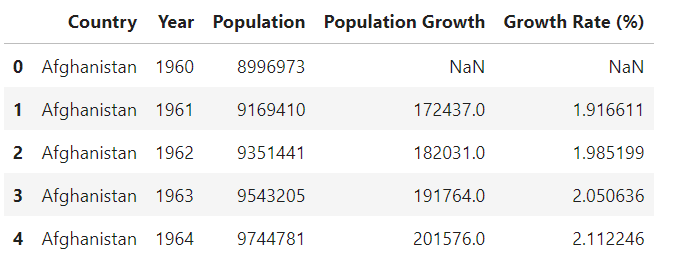
The dataset that will be used is located in kaggle.com as https://www.kaggle.com/datasets/gauravkumar2525/country-population-and-growth-rate-analysis. This dataset has 263 unique countries and territories whose population records span yearly from as early as 1960 to 2018. The population, population growth, and growth rate (%) are recorded for each year. This means we can ascertain when a country's population starts to decline. Let's see what the dataset looks like:
- Country
- ISO3 (Country Abbreviation)
- Year
- Population
- Population Growth
- Growth Rate (%)
- Decade

Understanding the Data
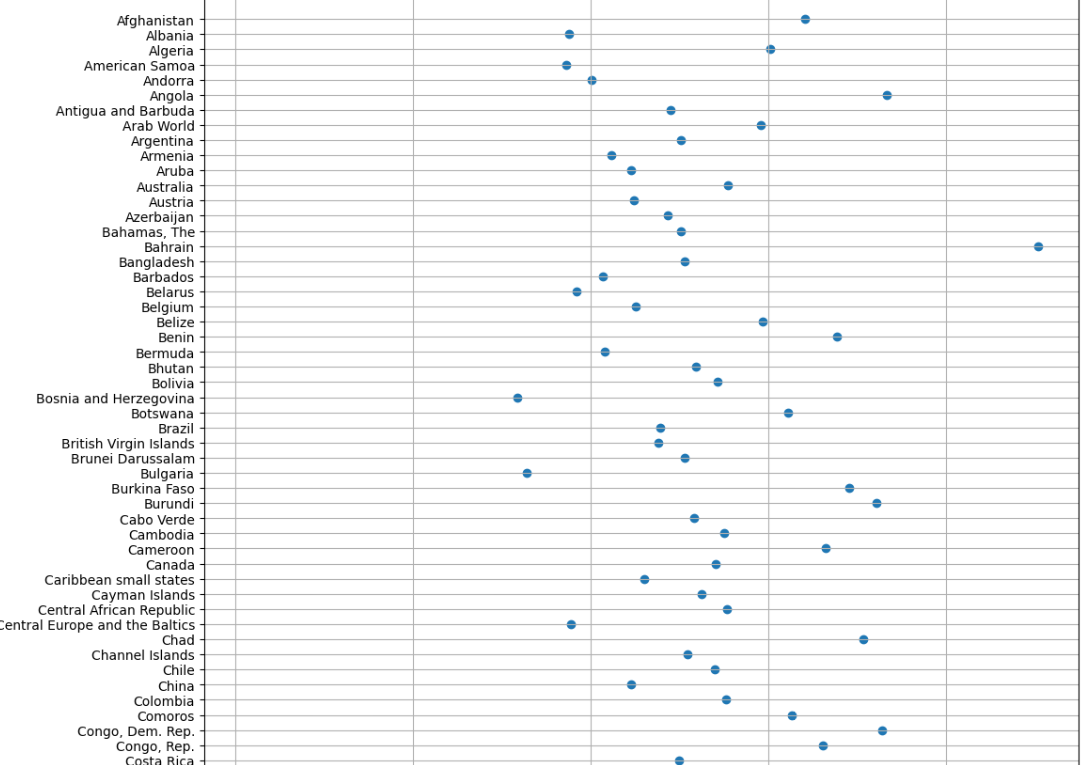
First let's see which countries and territories are experiencing population growth or decline in the most recent year, 2018.
*Portion of the Data Table
So there seems to be around a couple of dozen of countries whose population growth has been in the negatives in 2018 and many other countries are slightly above the 0 mark. The purpose of this graph is to demonstrate how we will predict future population growth values using clustering. We will compare a country's population growth trend throughout the years and predict what their rate will be at in the upcoming years.
Preprocessing the data
Since there are no null values besides the exception of a country's population growth numbers of their first year's (1960) data point, We would only need to drop a couple of columns that won't be used in the clustering method: the Decade and ISO3 columns.
Clustering Experiment
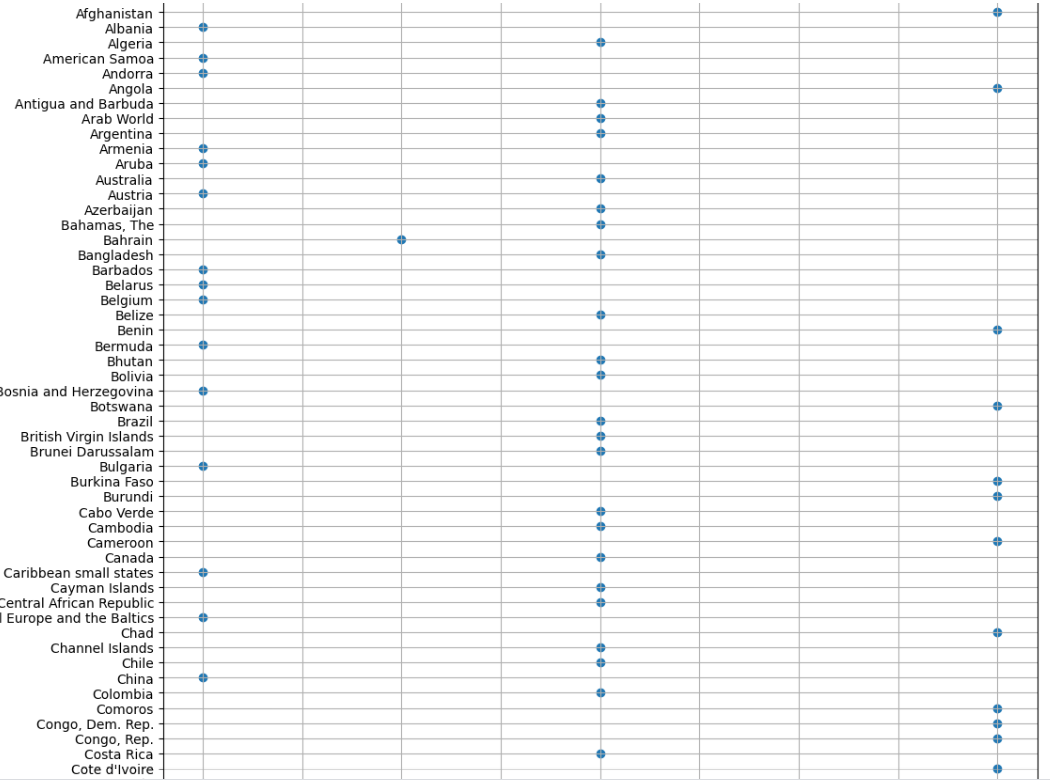
Since most of the data points are within the 0% to ~2.5% range with significant points between -2% to 0% and ~2.5% to 4%, we could say that it would be good for k to be within 4-6. For this experiment we will go with 5 clusters.
*Portion of the Data Table
Analysis
It seems like most countries went into either cluster 0 or cluster 2 with some going into cluster 4 and only one, Bahrain, going into cluster 1. These clusters can indicate a country's population growth status by labelling them either at risk for population collapse (Cluster 0), at maintenance level or starting to lower (Cluster 2), or booming populations (Cluster 4). From this data, it is apparent that there are a lot of countries at risk at population collapse and need to take action to stop it. Also, by doing a yearly checkup using this clustering method, a country can see in which direction their population growth is heading and start taking countermeasures to combat them.
Impact
This project has a good impact in understanding the situation that every country in the world is in by means of population growth rate. However, this project can also overinflate the impact of population decline since a lot of countries who are experiencing slight population decline haven't experienced significant negative impacts within their population demographics. Aside from these disparities, this project highlights what is to come in the near future regarding word population demographics.
References
Ahadli, T. (2020, January 7). A friendly introduction to K-means clustering algorithm. Medium. https://medium.com/@tarlanahad/a-friendly-introduction-to-k-means-clustering-algorithm-b31ff7df7ef1